Click Here to view the repository
RepositoryLeaflet - Earthquake Data Visualization
-
Objective
Develop a dynamic visualization tool for earthquake data, showcasing proficiency in JavaScript mapping using D3 and Leaflet plugins.
Methods
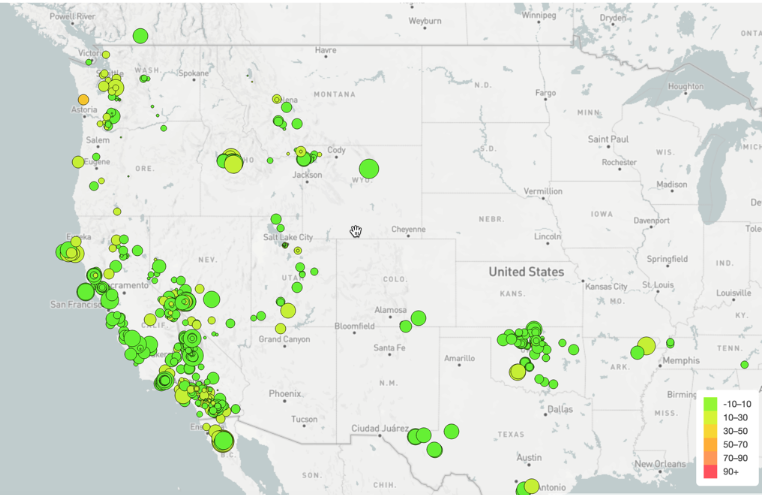
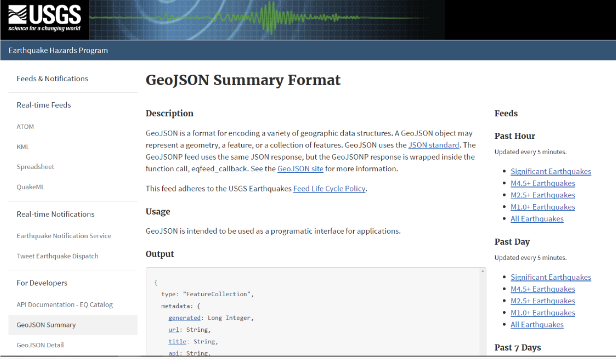
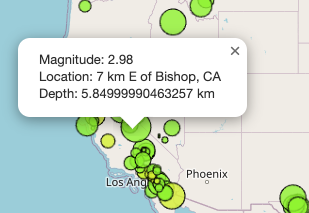
Fetched real-time earthquake data from the USGS GeoJSON feed. Utilized Leaflet to plot earthquake locations on an interactive map. Represented earthquake magnitudes through marker sizes and depths through color variations. Implemented popups for additional earthquake details and a legend for contextual information.Findings
Successfully visualized global earthquake data, providing clear insights into earthquake patterns and magnitudes. The map dynamically updates with the latest earthquake data, offering a real-time perspective.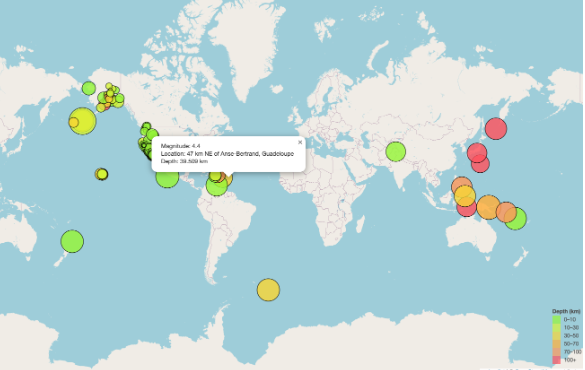
Impact
Enhanced public and governmental understanding of earthquake activities. Provided a compelling tool for the USGS to educate stakeholders and potentially secure additional funding.Challenges
Handling large datasets and ensuring smooth map rendering. Accurately representing earthquake data through intuitive visual elements.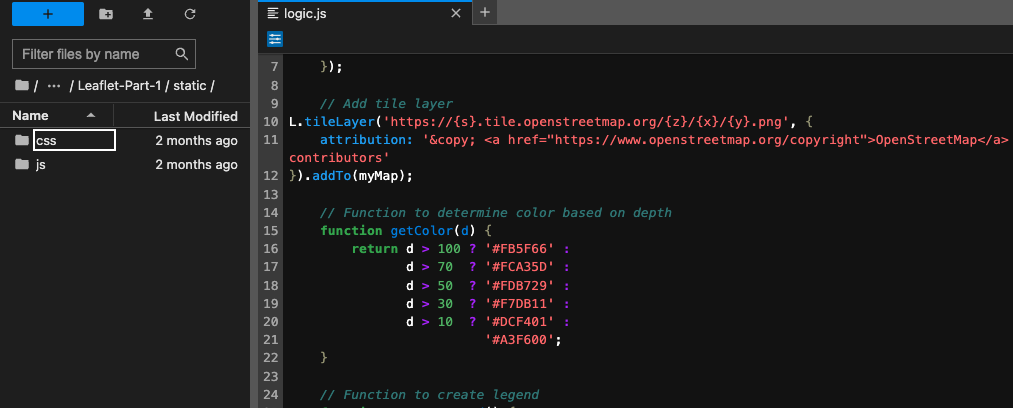

Tools Used
Terminal Jupyter lab Anaconda HTML css JavaScript D3 Library Leaflet