Click Here to view the repository
RepositoryExcel Campaign Data Analysis
-
Objective
Analyze a database of 1,000 sample crowdfunding projects to identify hidden trends and uncover the "tricks" to success for crowdfunding campaigns using Excel.
Methods
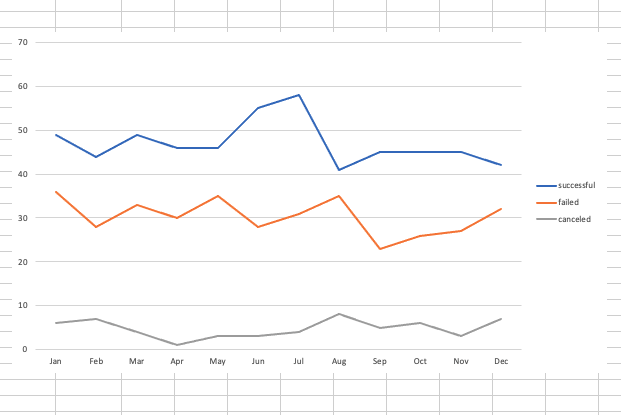
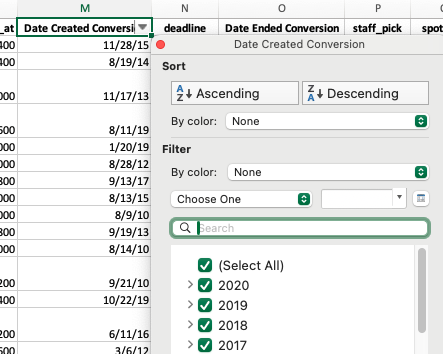
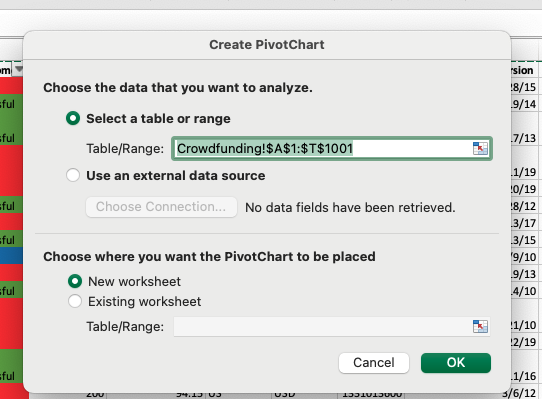
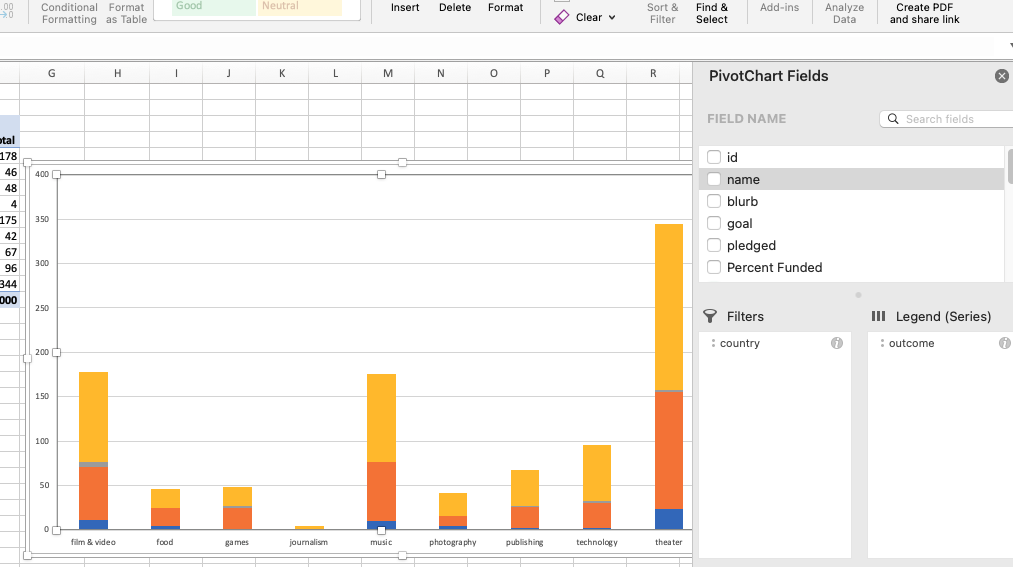
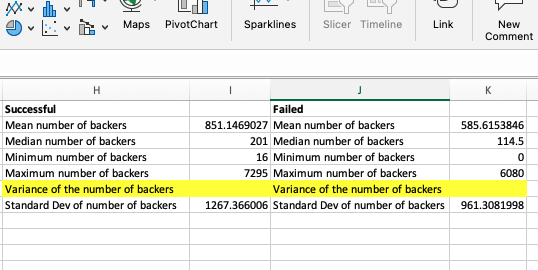
Data Preparation: Modified and analyzed the sample project data using Excel. Applied conditional formatting to the "outcome" column for campaign status differentiation. Created new columns for "Percent Funded" and "Average Donation" with conditional formatting. Split the "Category and Sub-Category" column into "Parent Category" and "Sub-Category." Data Analysis: Category & Subcategory Stats: Created pivot tables and stacked-column charts to count campaign outcomes by category, filterable by country Date Conversion: Converted Unix timestamps to normal dates, adding "Date Created Conversion" and "Date Ended Conversion" columns. Outcomes Based on Launch Date: Created pivot tables and line charts to show outcomes by launch date, filterable by parent category and year. Crowdfunding Goal and Statistical Analysis: Created a new sheet with goal ranges, project counts, and success/failure percentages. Used COUNTIFS() formula and created a line chart to graph the relationship between goal amounts and success rates. Generated summary statistics (mean, median, min, max, variance, standard deviation) for both successful and unsuccessful campaigns.Findings
Most parent categories exhibit a balanced distribution of successful and failed campaigns, except for technology, which saw increased success from 2010 to 2020. Campaigns with goal budgets ranging from $15,000 to $25,000 and $30,000 to $35,000 had nearly 100% success rates. 73% of campaigns were based in the United States, with theatres/plays being the majority.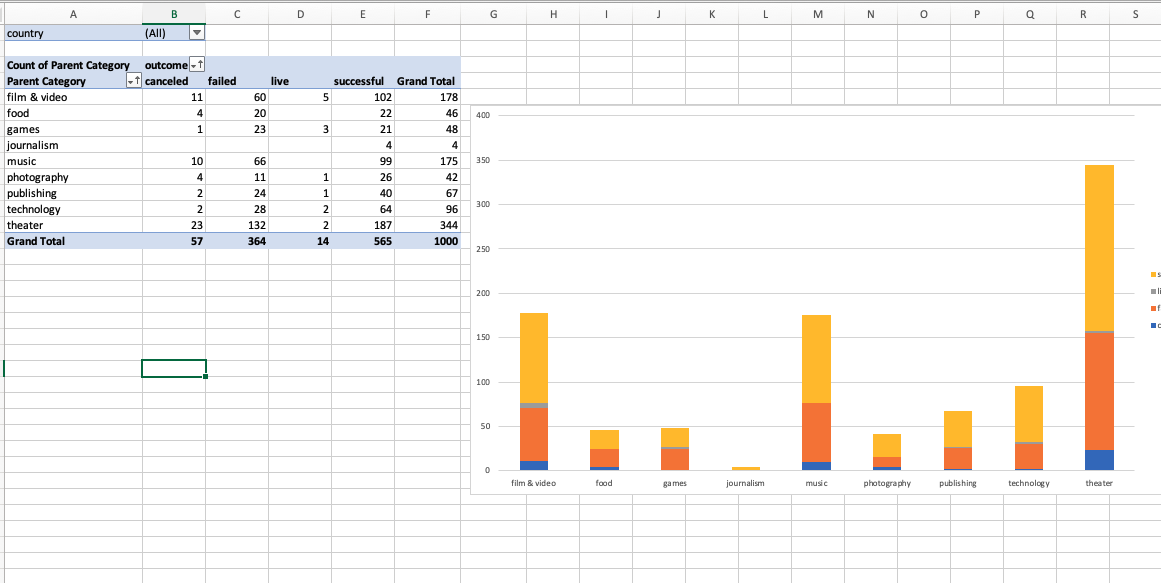
Impact
Provided actionable insights for optimizing crowdfunding strategies and resource allocation. Highlighted specific goal ranges and categories with higher success rates, aiding in future campaign planning.Challenges
Incomplete data on campaign backers' professions and marketing methods, limiting comprehensive analysis. Lack of detailed duration data to fully understand the impact of campaign duration on success rates.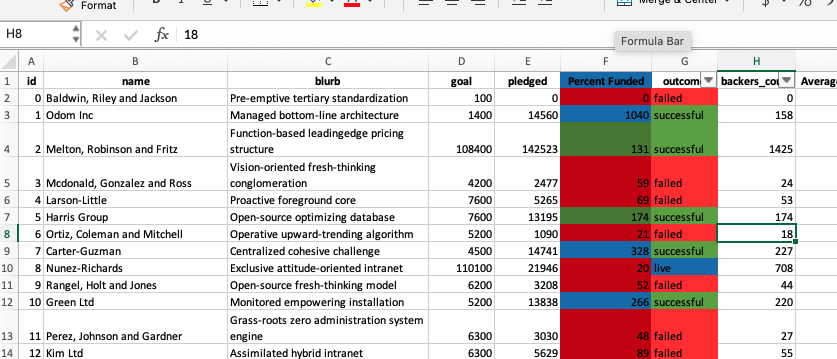

Tools Used
Excel