Click Here to view the repository
RepositoryJavaScript - D3 Biodiversity Analysis
-
Objective
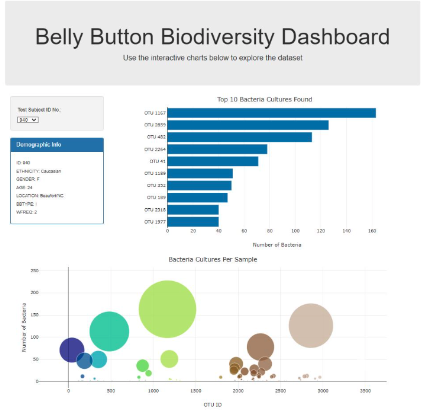
Develop an interactive dashboard to explore the Belly Button Biodiversity dataset, demonstrating skills in JavaScript, HTML, and the D3 library.


Methods
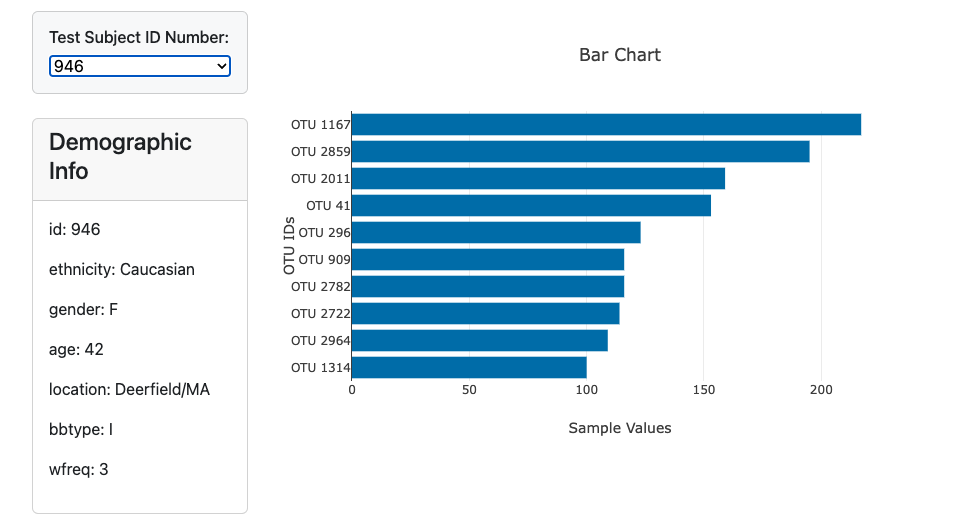
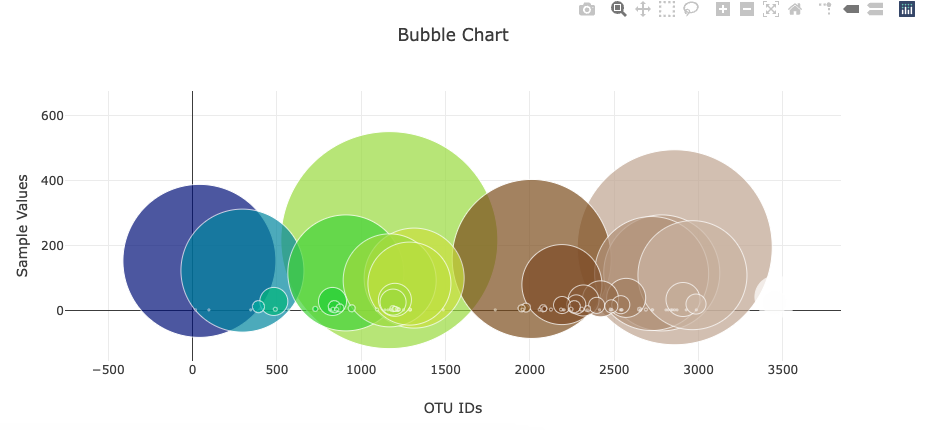
Utilized D3.js to read in sample data from a provided JSON file. Created dynamic visualizations including bar and bubble charts using Plotly.js. Implemented a dropdown menu for selecting individual samples, updating charts accordingly. Displayed metadata information related to each selected sample in a dedicated panel.Findings
Successfully visualized microbial species data, highlighting the most prevalent OTUs in individuals. Provided interactive elements for users to explore specific data points and demographic information.

Impact
Enabled a deeper understanding of microbial biodiversity in human navels. Offered an engaging tool for educational purposes, allowing users to interact with and learn from real scientific data.Challenges
Ensuring smooth interaction and updating of charts when new samples are selected. Accurately representing complex data in a user-friendly format.

Tools Used
Terminal Jupyter lab Anaconda HTML css JavaScript D3 Library