Click Here to view the repository
RepositoryAPI Vacation Planning Analysis
-
Objective
Explore my project, which showcases skills in utilizing API calls, creating documentation, and employing visualization tools

Method
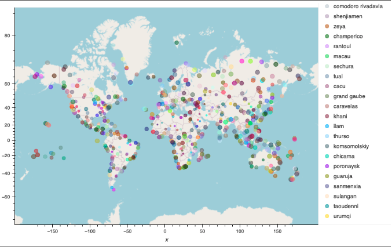
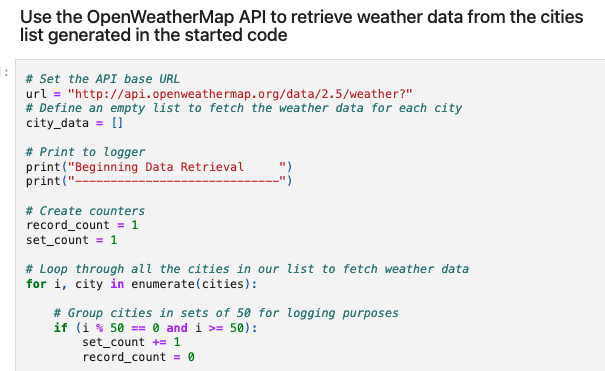
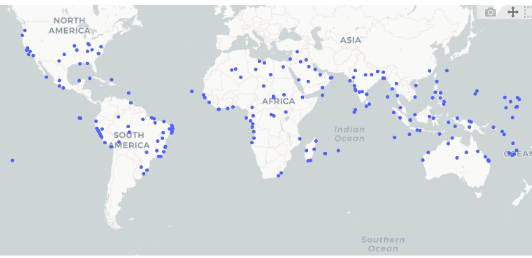
Part 1: WeatherPy Utilized Python scripts to interact with the OpenWeatherMap API and visualize weather data for over 500 cities. Implemented scatter plots to illustrate relationships between weather variables (temperature, humidity, cloudiness, wind speed) and latitude. Conducted linear regression analysis for each relationship, distinguishing between Northern and Southern Hemispheres. Part 2: VacationPy Applied weather data analysis skills to plan vacations using Jupyter notebooks and the Geoapify API. Created interactive maps displaying cities based on humidity levels, filtered for ideal weather conditions. Integrated Geoapify API to locate hotels near selected cities, enhancing the travel planning experience.Findings
WeatherPy: Clear correlations observed between latitude and temperature, with temperatures generally higher closer to the equator. Humidity and cloudiness show no significant latitude-based trends, while wind speed tends to increase at higher latitudes. VacationPy: Identified cities with ideal weather conditions for vacations based on user-defined criteria such as temperature range and wind speed. Successfully located nearby hotels using Geoapify API, facilitating informed decision-making for potential travelers.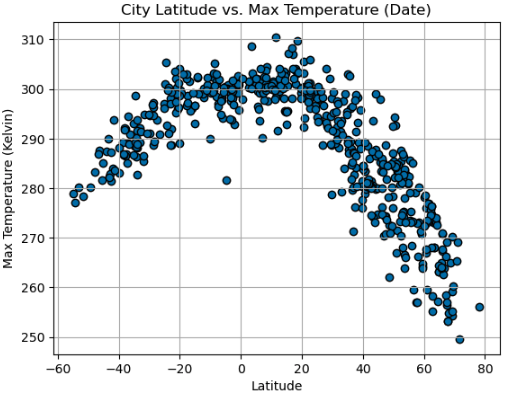
Impact
This project underscores the ability to leverage Python programming, APIs, and data visualization tools to extract meaningful insights from weather data and facilitate travel planning. Demonstrates practical application of data analysis skills in real-world scenarios, preparing for tasks requiring API integration and geographic data manipulation.Challenges
Managing API rate limits and ensuring robust error handling during data retrieval. Balancing data visualization aesthetics with clear and informative plotting of geographic and weather data. Addressing geographical bias in city selection to ensure comprehensive dataset representation across latitudes and longitudes.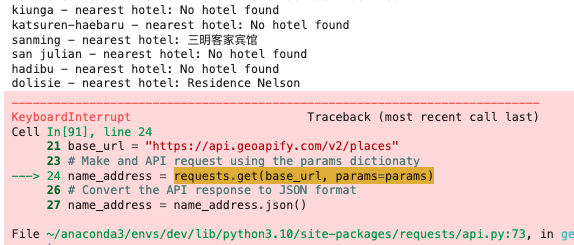
Tools Used
Terminal Jupyter lab Anaconda Matplotlib Openweather Geoapify